Blood pressure is an important indicator of cardiovascular health.
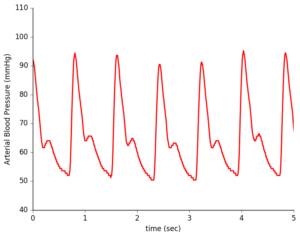
During a typical checkup, your doctor checks that your blood pressure is within a healthy range with a blood pressure cuff squeezing tightly around your upper arm. In contrast, an arterial line directly measures your heart’s mechanical contraction, providing much more detailed information that can be used for clinical diagnoses of cardiac conditions. However, this technique is typically only used in intensive care medicine and during anesthesia due to its invasiveness and risk of complications.
As a Health Data Science Fellow @ Insight, I consulted with a Bay Area startup that has developed an exciting new wearable sensor that provides the combines the detailed waveform data from the arterial line with the non-invasive convenience of the blood pressure cuff. In the future, this could provide doctors with the ability to safely and continuously monitor the heart health of at-risk patients, outside of a critical care context, allowing them to catch cardiac problems long before they would currently be diagnosed.
Non-invasive sensors provide waveform shape but not direct blood pressure measurements.
While this group has developed computationally intensive methods for predicting blood pressure from these waveforms, they require increased accuracy before this device can come to market. To determine where to focus their efforts, they asked me to identify patient populations with distinct waveforms, as different groups may require a separate processing pipeline. To address this problem, I began with the MIMIC-III clinical database, which has a decade of extensive health-related data from the hospital admissions of more than 40k patients. In addition, the startup company provided me with 250k pulse waveform records not attached to any clinical or demographic information.
So, how to match these records to their specific hospital admission? I examined the MIMIC schema and observed that for each patient, there were potentially many hospital admissions, each of with a specified start and end time. So, after loading the database into Postgres for easy access, I cross-referenced the waveform recording times (indicated by their filenames) with these admissions and began to explore the types of demographic profile of these waveform records – what types of patients did I have waveforms for? What were their diagnoses during their admission?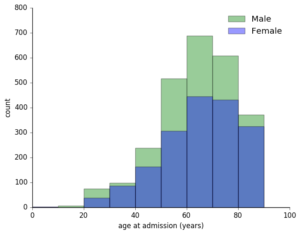
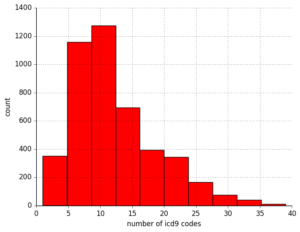
First, I determined that for these 250k pulse waveforms, there were around 7k unique patient records. Of these about 60% were men, with a predictable skew towards older patients given that this technique is used in critical care conditions. I saw that for any given admission, a patient could have up to 30+ diagnostic codes! Fortunately, they had a primary diagnosis, so to reduce the complexity of this data, I started with this.
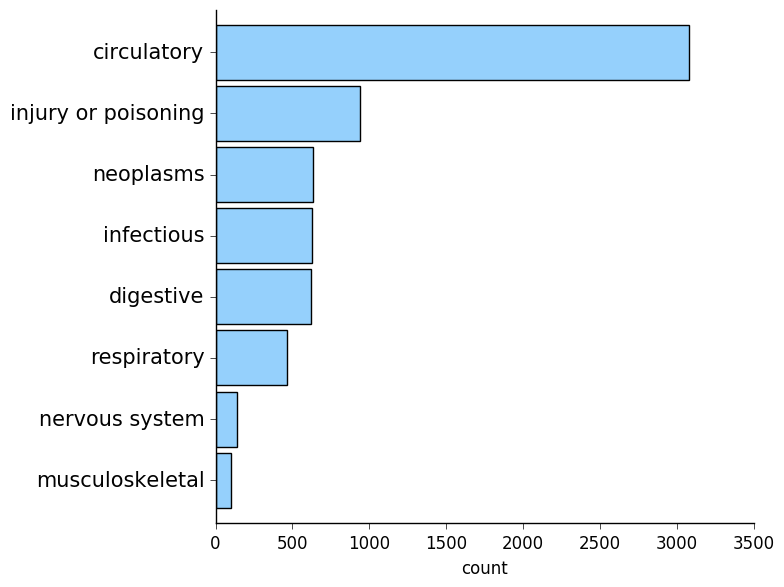
Unsurprisingly, circulatory diagnoses were the most common!
Check back in later for additional details, and for now, take a look at my demo for some of my conclusions!